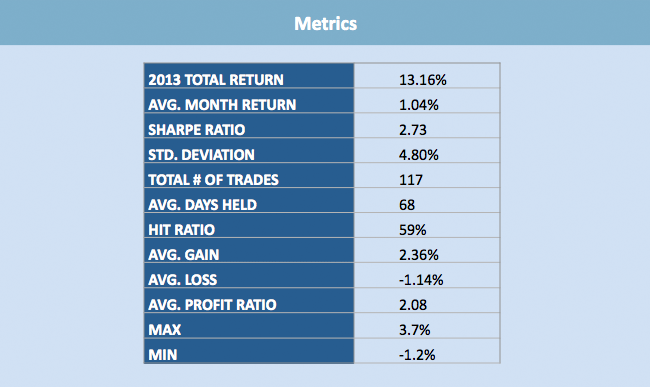
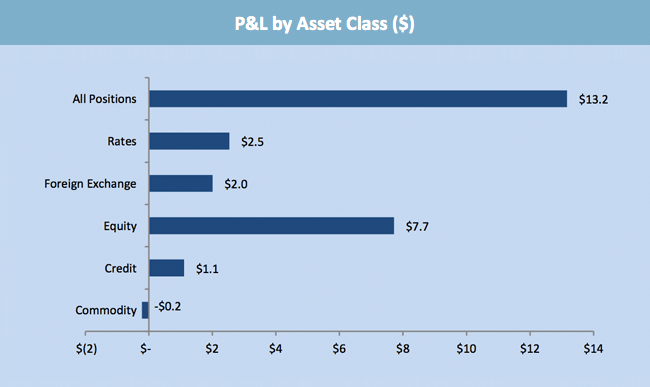
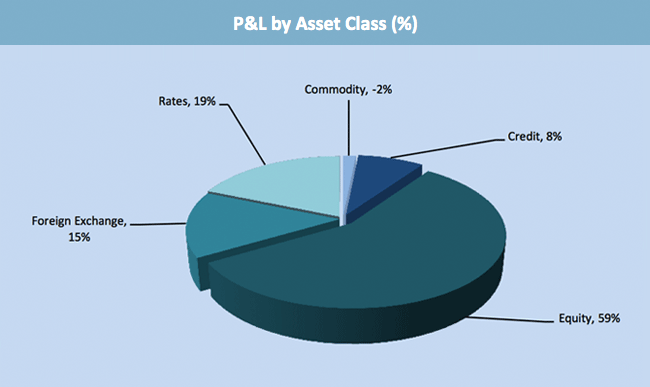
Our process is consistent and transparent.
Our trading recommendations and macro investment strategies are captured in a model portfolio, which is updated weekly and included in Sight Beyond Sight™. We have no actual positions, so you will never have to ask if we are “talking our book”. We are committed to helping you with yours.
Model Portfolio — Macro Strategy
- Objective: To achieve double-digit returns with single-digit volatility.
- Main benchmark: Credit Suisse Global Macro Index (symbol: HEDGGLMA)
- Custom benchmark: 40% MSCI World Index, 30% Barclays Aggregate Index, 20% US Dollar Index, 10% S&P GSCI Total Return Index
FAQ
What is the starting Net Asset Value (NAV) of the model portfolio for 2015?
The starting NAV for 2015 is $300,000,000.00.
What was the starting and ending Net Asset Value (NAV) of the model portfolio for 2014?
The starting NAV for 2014 was $113,137,939.11. The ending NAV was $133,310,564.82.
What was the starting and ending Net Asset Value (NAV) of the model portfolio for 2013?
The starting NAV for 2013 was $100,000,000.00. The ending NAV was $113,137,939.11.
What does a 1 UNIT position size refer to?
1 UNIT = $1,500,000 or 50 basis points (0.5%) of the Net Asset Value (NAV)
What are the “Accounts Based Leverage Rules” for each asset class?
Equities: 150% of NAV
Fixed Income: 125% of NAV
Foreign Exchange: 125% of NAV
Commodities: 50% of NAV
How do you calculate the closing price for an option position?
The closing price for an option position is calculated by using the mid-price of the closing bid/ask spread.
How do you account for the financing cost of a Delta One (i.e. CFD) equity position?
Long Delta One (i.e. CFD) positions include a borrow cost based on an annual stock loan/borrow fee of daily Fed Funds less 30 bps
Short Delta One (i.e. CFD) positions include a borrow cost based on an annual stock loan/borrow fee of daily Fed Fund plus 30 bps.
How do you account for the stock loan (or borrow) fee for short equity positions?
For general collateral , short equity positions include a borrow cost based on an stock loan/borrow fee of daily Fed Funds less 30 bps.
How do you account for the fees associated with trading credit default swaps (CDS)?
As per industry standard Credit Default Swap positions include collateral or upfront financing costs of 1% of notional annualized.
How do you account for the carry/yield associated with spot and non-deliverable forward (NDF) positions?
Currency positions includes the impact of interest rate differentials based on either the 1-month, 3-month or 1-year NDF yields at the time the position was opened.
How do you account for the carry/yield associated with cash fixed income positions?
Cash fixed Income positions include carry/yield and the net financing cost based on the overnight repo rate for that specific bond duration.
How do you determine the price of trade executions?
Depending on the instrument the entry or exit price is based on a volume-weighted average price (VWAP) or time-weighted average price (TWAP) for that trading day unless stated otherwise.
How do you account for equity commissions?
Equity transaction costs are equal to $.005 (1/2 cent) per share.
How do you account for Delta One (CFD) commissions.
Delta One (CFD) costs are equal to 10 bps of the notional executed.
How do you account for exchange traded equity option commissions?
Exchange traded equity option costs are equal to $0.50 per contract.
How do you account for Futures and Options on Futures commissions?
Futures and Options on Futures commissions are equal to $0.75 and $1.00 prime brokerage clearing fee per contract (i.e. $1.75 entry + $1.75 exit = $3.50 Round Lot).
What costs or variables are not accounted for in the model portfolio PnL?
1. Initial and secondary margin requirements for Futures and Options on exchange traded futures positions.
2. Fees or margin requirements on exchange traded cash and options positions.
3. Advisory, Management, and/or Performance Fees.
4. Custodial fees and other administrative expenses.
5. Tax Implications arising from the sale or purchase of securities, which in actual trading do have an impact on gains and losses.
6. Market impact.
7. Liquidity.
What does the “T” denote in the model portfolio?
The “T” denotes a short-term trading idea that is managed with a tight stop loss and assessed on the basis of whether the thesis continues to support the tactical theme.
What does the “S” denotes in the model portfolio?
The “S” denotes a strategic idea that is managed with a wide stop loss and assessed on the basis of whether the fundamentals continue to support the medium-term investment theme.
Disclaimer
Rareview Macro LLC (“RVM”) is not registered as an investment adviser with the Securities and Exchange Commission (SEC) or any state. RVM relies on the “publisher exclusion” from the definition of an investment adviser under Section 202(a)(11) of the Investment Advisers Act of 1940 and corresponding state securities laws.
RVM provides bona fide research services and investment newsletters that are generally available for subscription by the public. It does not provide individual customized investment advice; therefore, no consideration is made towards your individual financial circumstances. All contents presented within www.rareviewmacro.com (“Website”) are not to be regarded as investment advice. It is for general informational purposes only.
Sight Beyond Sight (“SBS”) is a bona fide publication of general and regular circulation offering and is limited to the dissemination of impersonal and objective investment-related information, together with access to additional impersonal investment-related information and links.
All model portfolios and results provided on this Website or in SBS are based on hypothetical trading, which means they are done on paper or electronically based on real market prices at the time the recommendation is disseminated to the subscribers of this service, but without actual money being invested.
Model portfolio performance results have certain inherent limitations. There is no guarantee past performance will be indicative of future results. No assurances can be given that the trades posted by RVM will be profitable or will not be subject to losses. RVM does not guarantee profits of any kind, nor can RVM protect you from losses. RVM makes no representations or warranties that any person or entity will or is likely to achieve profits similar to those shown in their model portfolios, because hypothetical or simulated performance is not necessarily indicative of future results.
No independent party has audited the hypothetical model portfolio performance at this Website or in SBS, nor has any independent party undertaken to confirm that it adheres to the assumptions or conditions specified herein.
In an effort to ensure that any advertisement provided is not misleading RVM believes that use of a model portfolio is the most valid approximation it can provide a prospective subscriber as to what our recommendations have been since inception. While no form of investment performance measurement is entirely without fault, of all those available to RVM this method is the one which provides the least amount of bias and is the best proxy for our investment approach and track record.
RVM feels it is important that prospective subscribers see how the investment returns being presented to them were achieved. We have taken extensive steps to insure that the reporting format is an objective one. Use of the model portfolio allows people to see what securities or instruments we hold and what the recent transaction activity has been. They can develop an understanding for our investment style that would otherwise be difficult to achieve prior to entering into a subscription with our firm.
In order to ensure there is no concern about the potential for misunderstanding of the model portfolio’s purpose on the part of the public we have incorporated the following statement:
The Rareview Macro Model Portfolio – Macro Strategy, as seen on this Website or in Sight Beyond Sight, represents a fictional account which RVM attempts to manage in a manner similar to that of an alternative investment manager that deploys a global macro and absolute return strategy. The investment objective over a one year time period is to generate double digit returns and at the same time limit volatility in such a way as to avoid the incurrence of a negative return.
While the results presented at this Website are based on certain assumptions that are believed to reflect actual trading conditions, these assumptions may not include all variables that can affect, or have affected in the past, the execution of trades indicated by RVM.
Unlike an actual performance track record, simulated trades do not represent actual trading. Also, since the trades may not have been actually executed, the results may have over or under compensated for the impact, if any, of certain market factors.
The hypothetical portfolio results on this Web site are based on the following assumptions:
1. The simulation assumes that prices are not influenced by the trades of RVM regardless of the number of contracts, shares quantity, or notional amount executed.
2. The simulation assumes purchase and sale prices believed to be attainable. In actual trading, the prices attained may or may not be the same as the assumed order prices.
3. The securities or instruments chosen for the model portfolio may be volatile, and although the “purchase” or “sale” of a security in the model portfolio will be made in the model portfolio alongside an alert that is accessible (i.e. Twitter) to all subscribers at the same time, delivery delays and other factors may cause the price you obtain to differ substantially from the price at the time the alert was sent.
4. The prices of securities or instruments in the model portfolio at the point in time you begin subscribing to SBS may be higher than such prices at the time such securities or instruments were chosen for inclusion in the model portfolio.
By incorporating a model portfolio on this Website and in SBS, the following issues have been addressed:
1. Failure to disclose the effect of material market or economic conditions on the results portrayed (i.e., an advertisement stating that a fictional account appreciated in the value 10% without disclosing that the market or benchmark generally appreciated 15% during the same period);
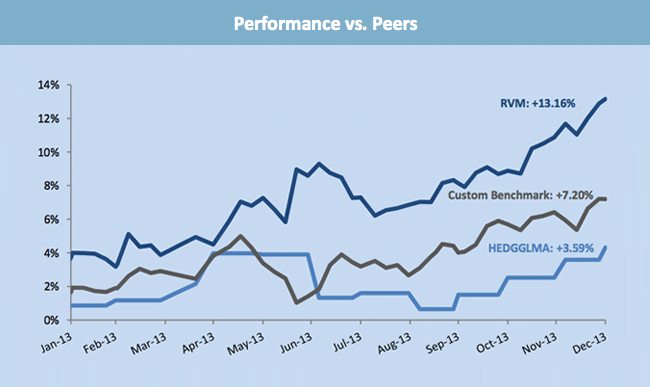
The Performance vs. Peers graph addresses this issue.
2. Failure to reflect the deduction of advisory or performance fees, brokerage or other commissions, and any other expenses that a client would have paid or actually paid;
All related inputs – commissions, dividends, advisory/performance fees, carry, borrow, etc. – are clearly illustrated as covered or not covered in the FAQ section or in this disclaimer.
3. Failure to disclose whether and to what extent the results portrayed reflect the reinvestment of dividends and other earnings;
Performance is reported in U.S. dollars and does NOT reflect the reinvestment of ALL dividends and other earnings.
4. Failure to suggest or makes claims about the potential for profit without also disclosing the possibility of loss;
RVM does not guarantee profits of any kind, nor can RVM protect you from losses.
5. Compares model results to an index without disclosing all material facts relevant to the comparison (i.e. an advertisement that compares model results to an index without disclosing that the volatility of the index is materially different from that of the model portfolio);
The Model Portfolio – Macro Strategy is benchmarked to the main peer index – the Credit Suisse Global Macro Index (symbol: HEDGGLMA). The volatility of the model portfolio and benchmark index is supposed to be similar.
6. Failure to disclose any material conditions, objectives, or investment strategies used to obtain the results portrayed (e.g., the model portfolio contains equity stocks that are managed with a view towards capital appreciation);
The model portfolio is managed in a manner similar to that of an alternative investment manager that deploys a global macro and absolute return strategy. The investment objective over a one year time period is to generate double digit returns (i.e. capital appreciation) and at the same time limit volatility in such a way as to avoid the incurrence of a negative return (i.e. capital preservation).
7. Failure to disclose prominently the limitations inherent in model results, particularly the fact that such results do not represent actual trading and that they may not reflect the impact that material economic and market factors might have had on the adviser’s decision-making if the adviser were actually managing clients’ money;
Results do not represent actual trading as illustrated above; RVM is not an investment advisor and does not manage client money. Therefore, material economic and market factors will not influence decision-making.
8. Failure to disclose, if applicable, that the conditions, objectives, or investment strategies of the model portfolio changed materially during the time period portrayed in the advertisement and, if so, the effect of any such change on the results portrayed;
The global macro strategy has been consistent since inception in 2013 and nothing has changed materially since then relative to what is portrayed in any advertisement.
9. Failure to disclose, if applicable, that any of the securities contained in, or the investment strategies followed with respect to, the model portfolio do not relate, or only partially relate, to the type of advisory services currently offered by the adviser (e.g., the model includes some types of securities that the adviser no longer recommends for its clients);
RVM is not an investment advisor and does not manage client money. Therefore, there is no conflict of interest.
10. Failure to disclose, if applicable, that the adviser’s clients had investment results materially different from the results portrayed in the model;
RVM is not an investment advisor and does not manage client money. Therefore, there is no conflict of interest.
11. Failure to disclose prominently, if applicable, that the results portrayed relate only to a select group of the adviser’s clients, the basis on which the selection was made, and the effect of this practice on the results portrayed, if material
RVM is not an investment advisor and does not manage client money. Therefore, there is no conflict of interest.

